One of the languages that we use the most in my team is Ruby. We love the syntax, the simplicity and the big and active community around it. Some time ago, we wrote about our SDK for the ePages shops and lots of things have changed since then. We’ve kept developing it to support more operations, such as data pagination and also to keep up with the releases of our colleagues from the API development team.
Status of the SDK
We are preparing a release Soon™ containing lots of model changes, in order to make the use of the gem even easier. For example, to get the customers of a shop, we used to have to do
  epages_shop.customers
  [<Epages::Customer:0x0000>, <Epages::Customer:0x0001>, ..., <Epages::Customer:0x0041>]
and then, iterate the array with all the customers.
But now, you can use other parameters that the API provides as page or results_per_page.
So you can do things like
  epages_shop.customers
  <Epages::CustomersResponse:0x0000
    @items = [<Epages::Customer:0x0000>, <Epages::Customer:0x0001>, ..., <Epages::Customer:0x0009>],
    @page = 1,
    @results = 42,
    @results_per_page = 10>
or with some parameters
  epages_shop.customers({ page: 2, results_per_page: 10 })
  <Epages::CustomersResponse:0x0000
    @items = [<Epages::Customer:0x0010>, <Epages::Customer:0x0011>, ..., <Epages::Customer:0x0019>],
    @page = 2,
    @results = 42,
    @results_per_page = 10>
so you have more control on the call and it gets easier to do batch operations. We also fixed some bugs and updated some dependencies.
Testing things in the console was fun, but we needed a real life scenario to check that the gem was working correctly and to find missing features. Lucky for us, our Product Owner came up with a perfect task for this. We needed to create a Sales Analytics App for the ePages App Store.
The new app in Rails
One of the things that I like the most about working at ePages is that we have lots of colleagues willing to help us. We had mockups, designs and texts for the whole Web App, so we could focus on programming.
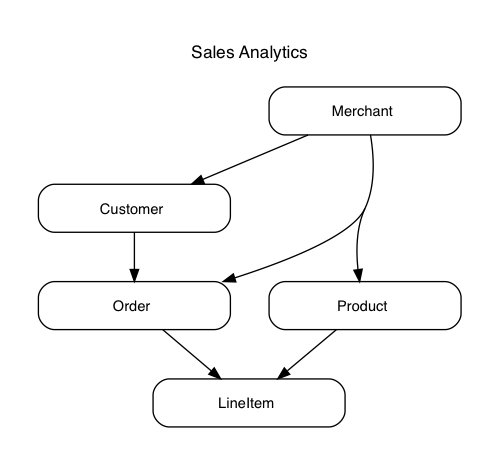
For simplicity we mimicked more or less the API models and added a bit of Rails Magic so it’s even easier to use.
After that, we created all the sections of the app: Dashboard, Sales, Products, and Customers. All these parts are bound to two dates (start date and end date) so the merchant can get even more useful data faster.
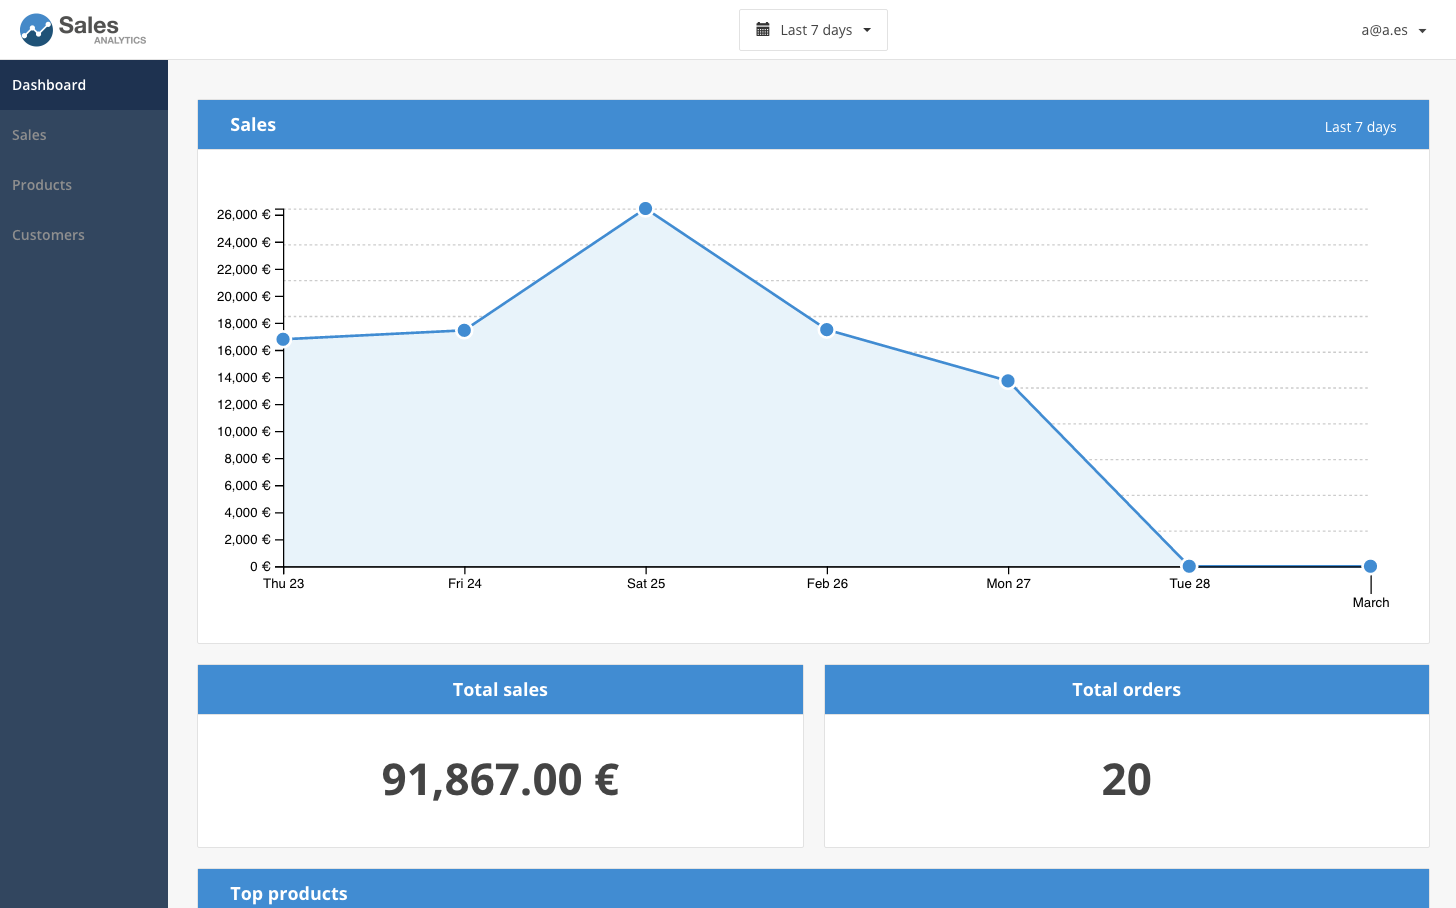
The main purpose of the Dashboard was to have all the basic information about a shop at a glance. So we decided to include a graph of sales, the amount of sales and orders, as well as the top products, and last orders.
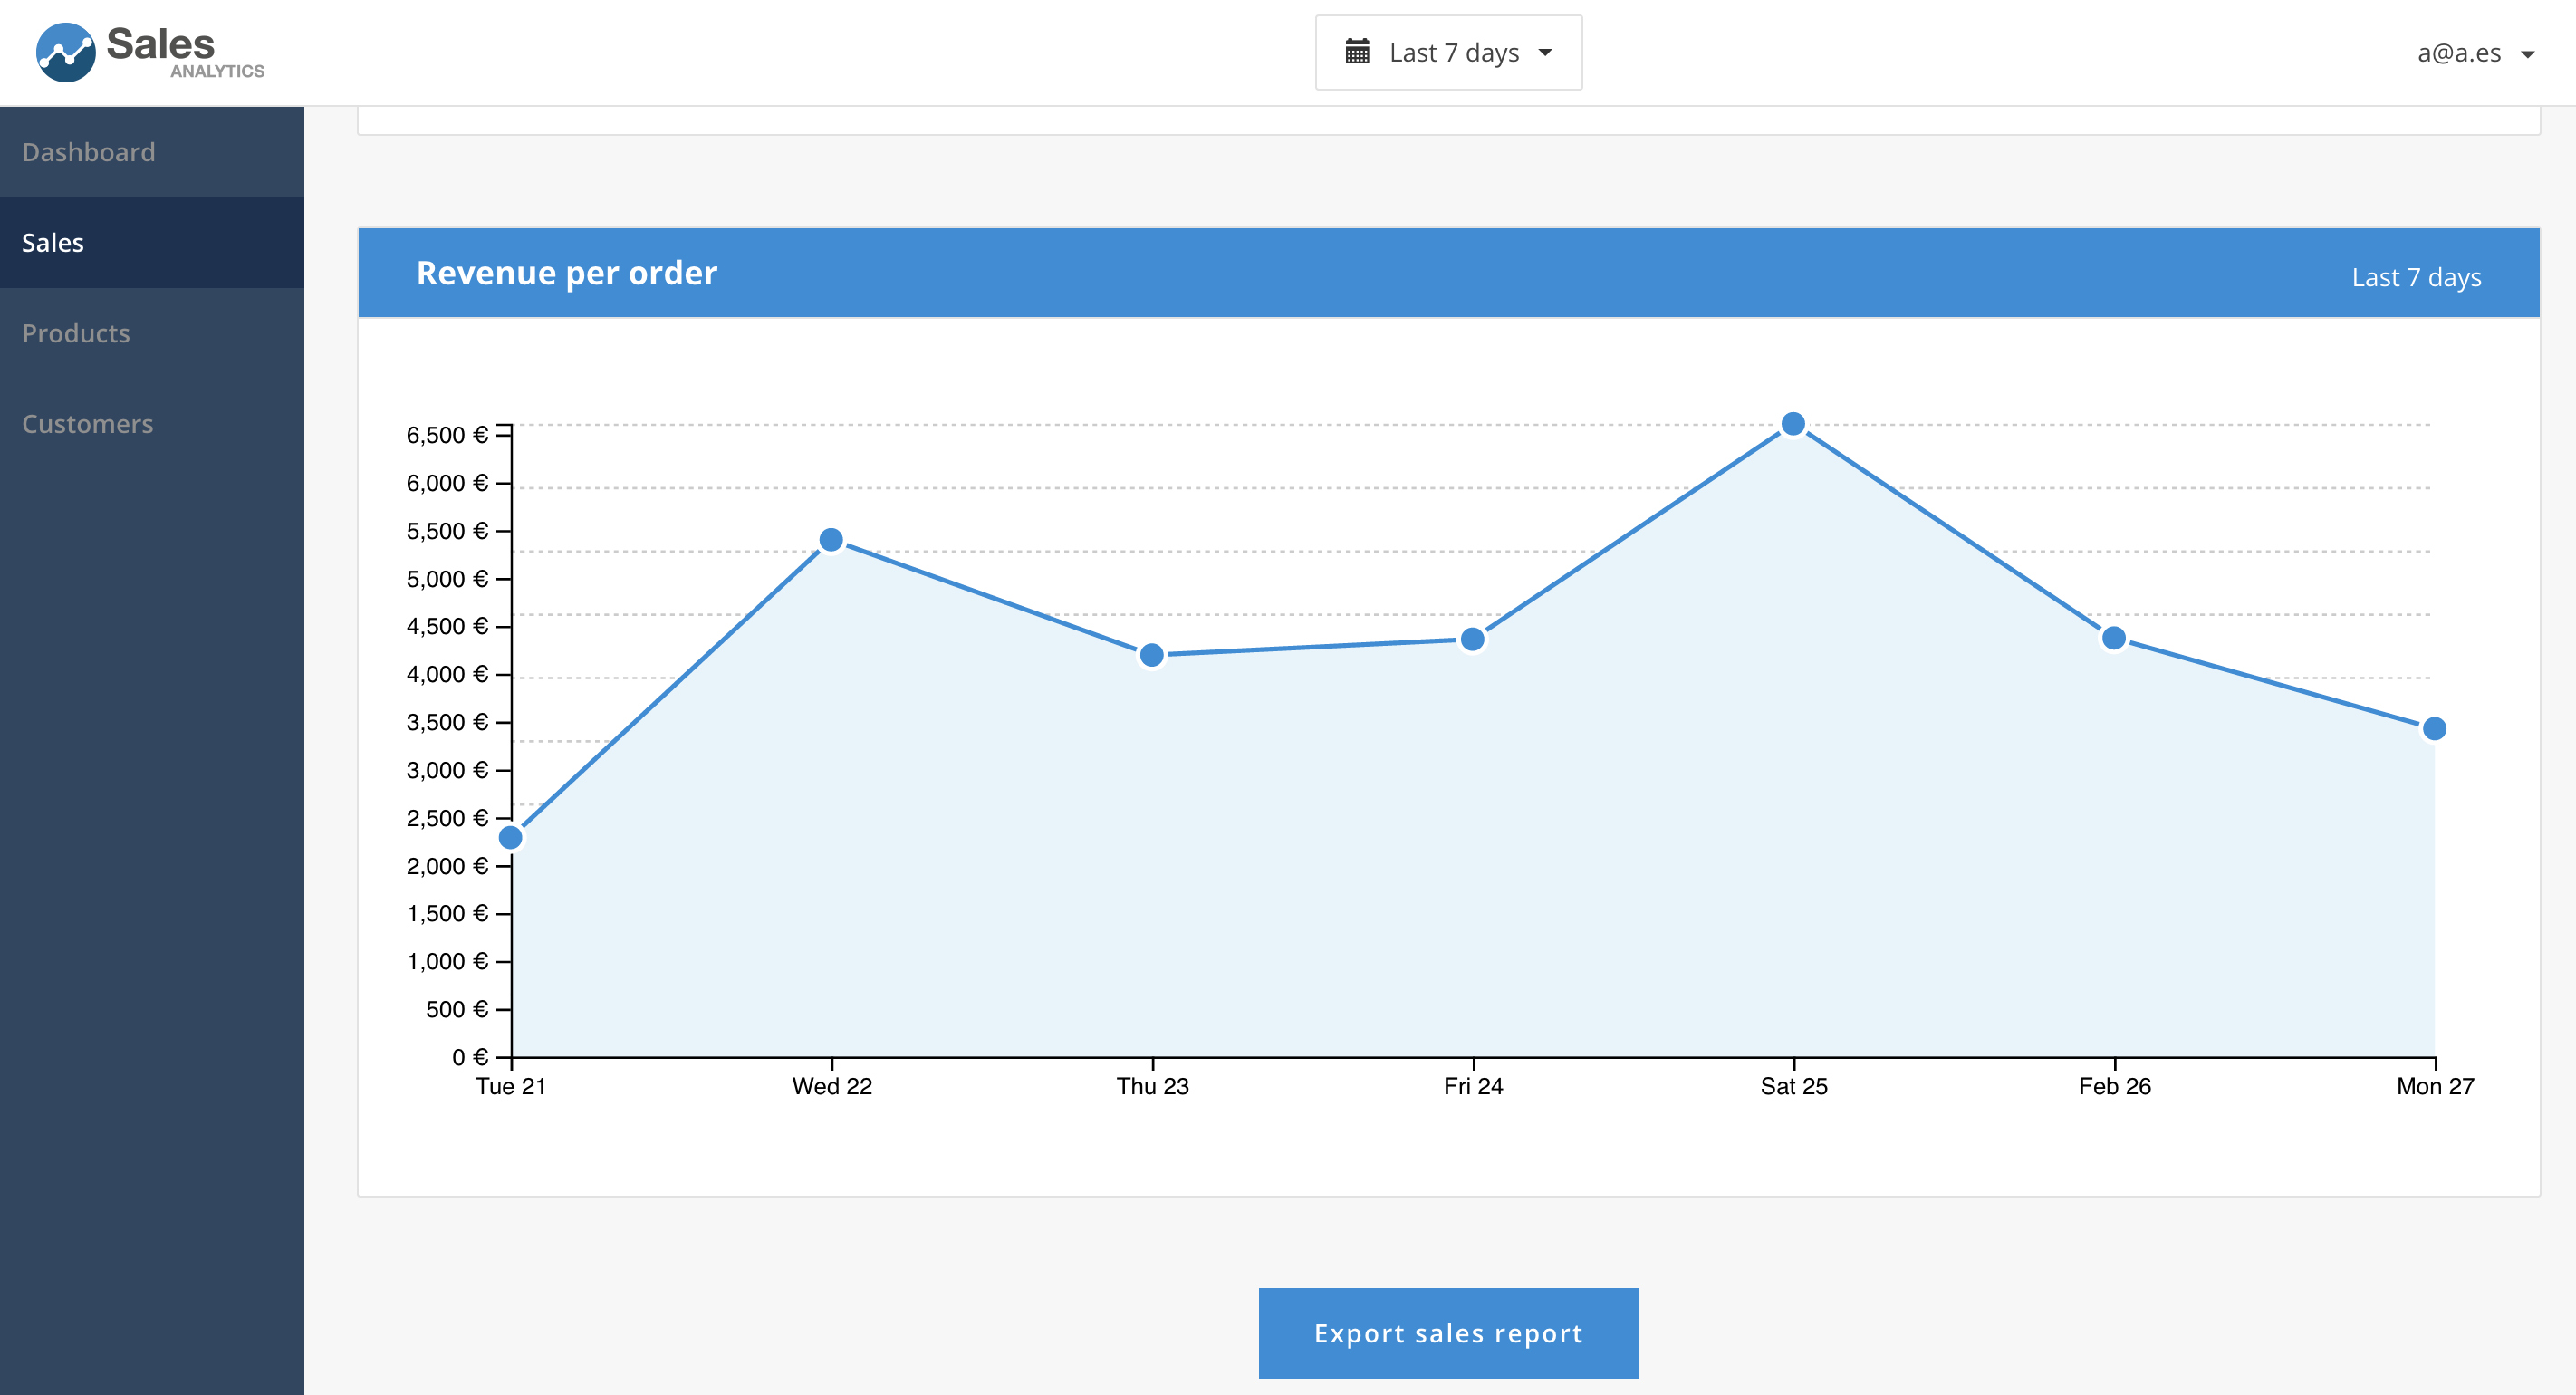
Then we included three charts on the Sales section.
The first is the same as in the Dashboard, the second one represents the orders on the selected time frame and the last is the revenue per order, the calculation between the first two graphs.
We also added the option to export the data to an xlsx file so the merchant doesn’t need an internet connection to review the sales.
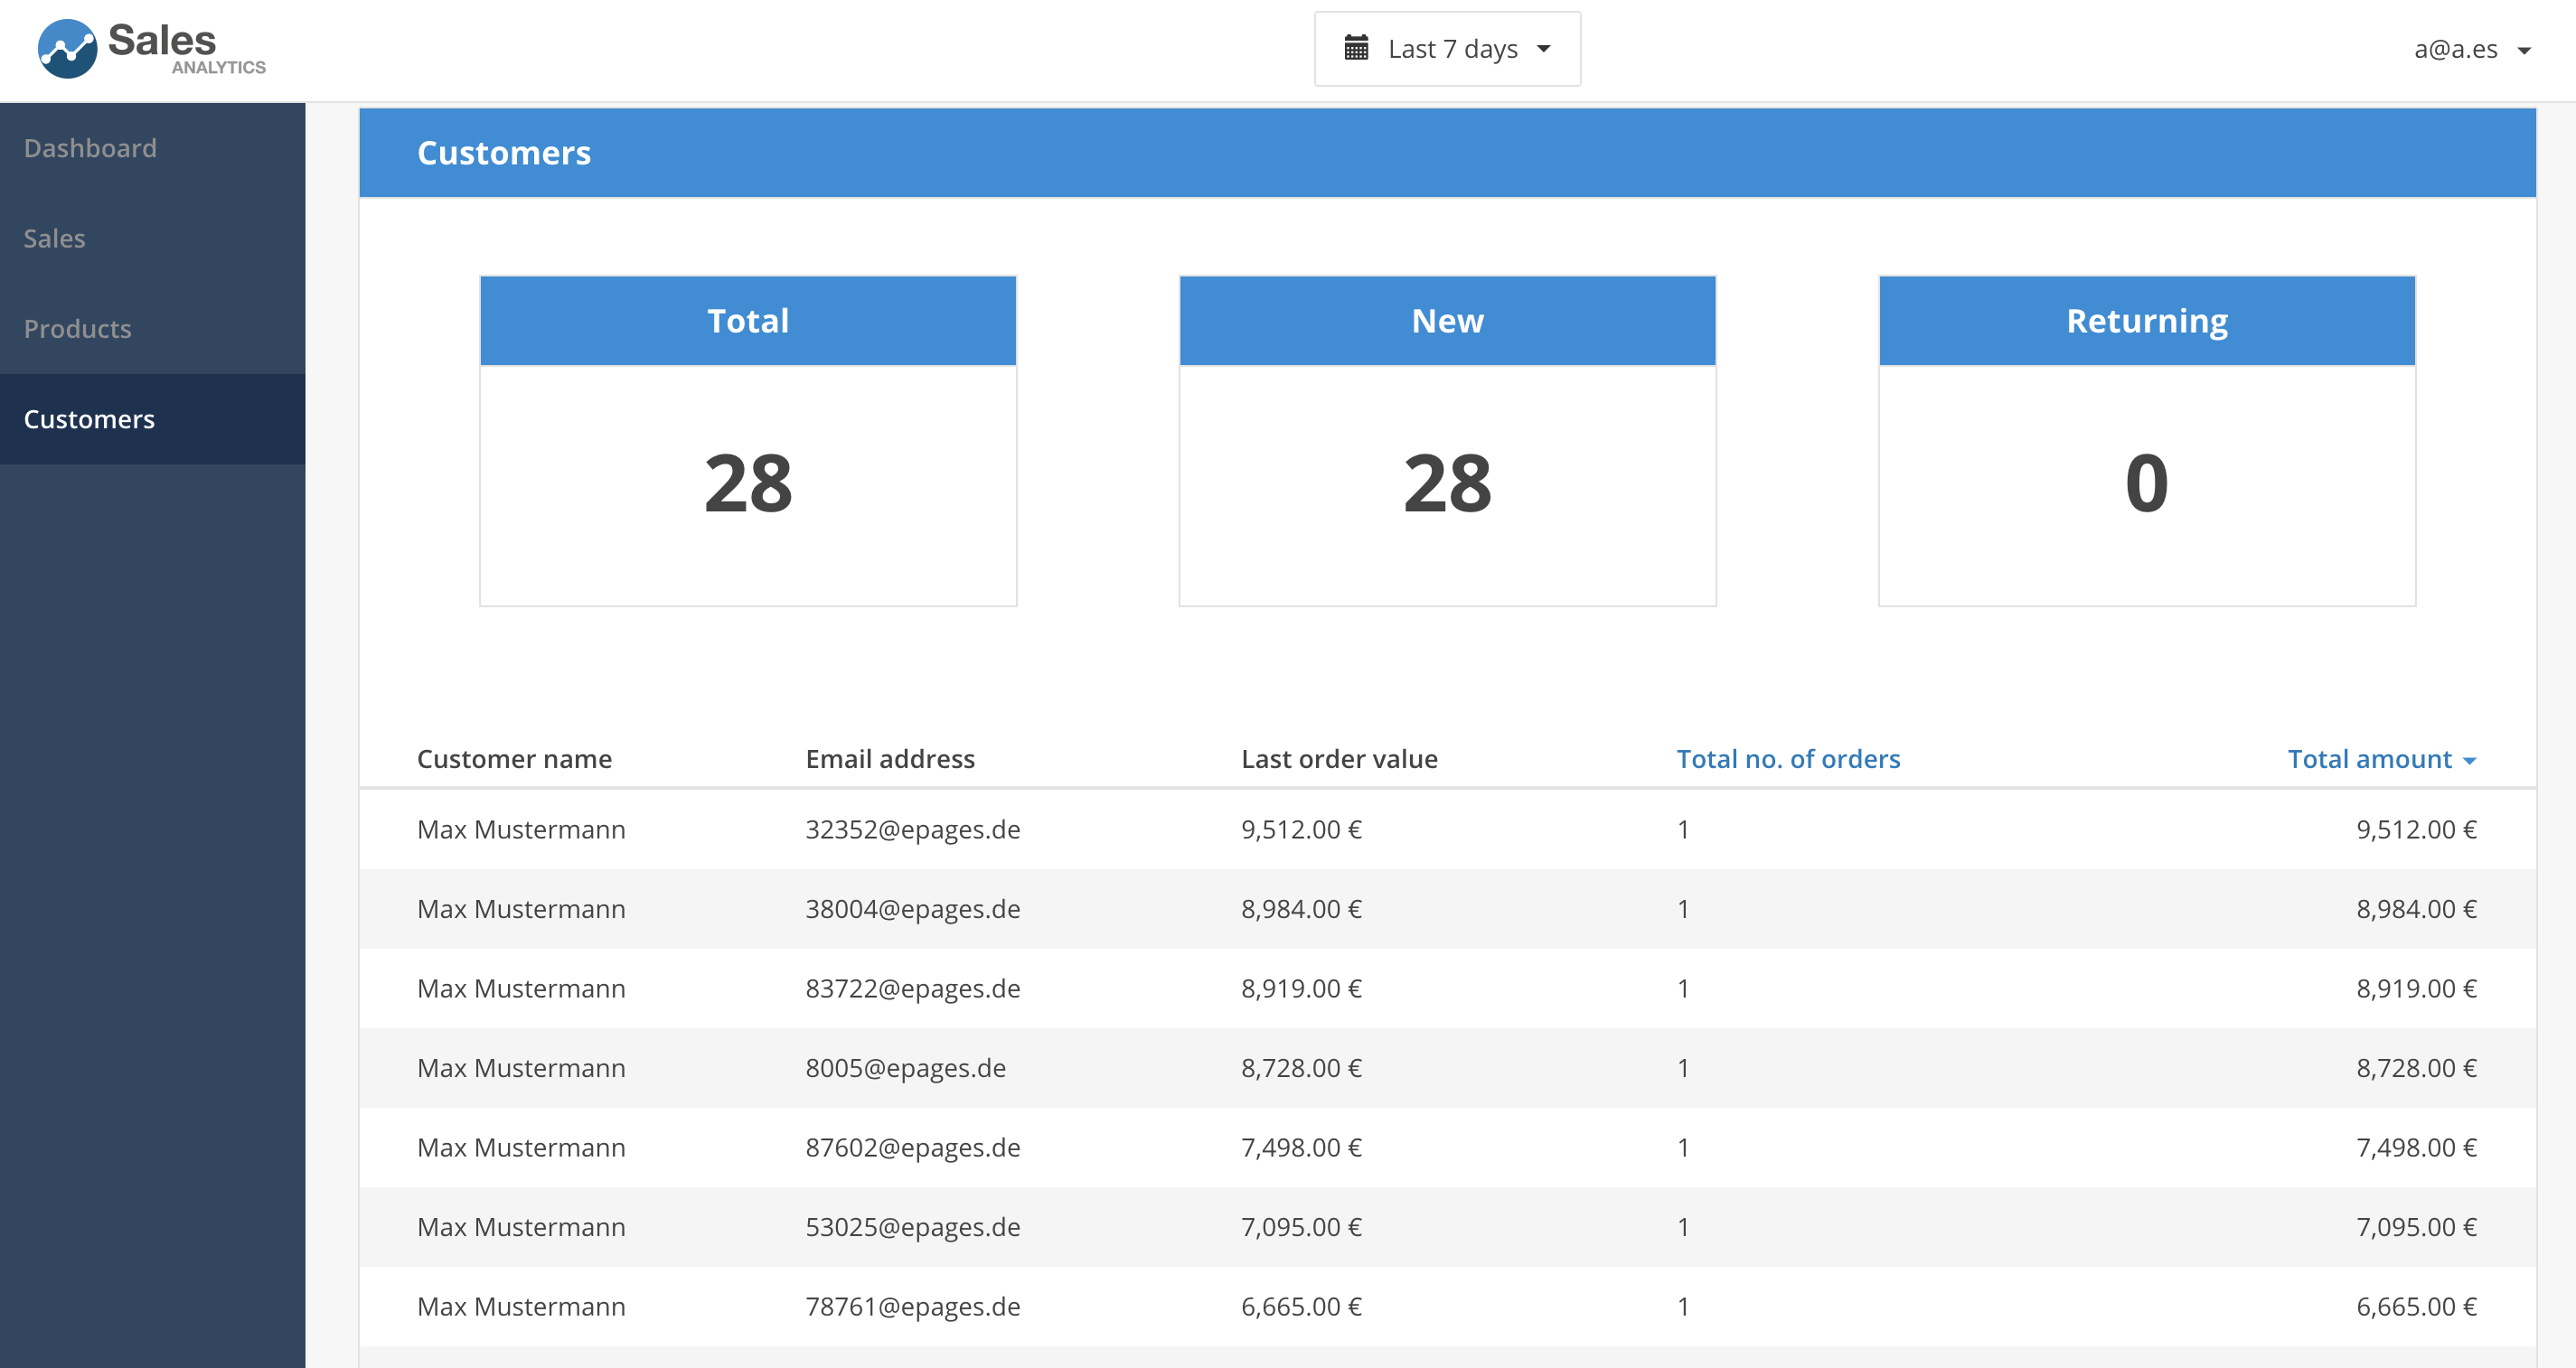
The Customers section is a simple table including all the merchant’s customers ordered by number of orders or the total amount spent. Above the table we can see all the customers for the specified time frame and and the number of returning customers.
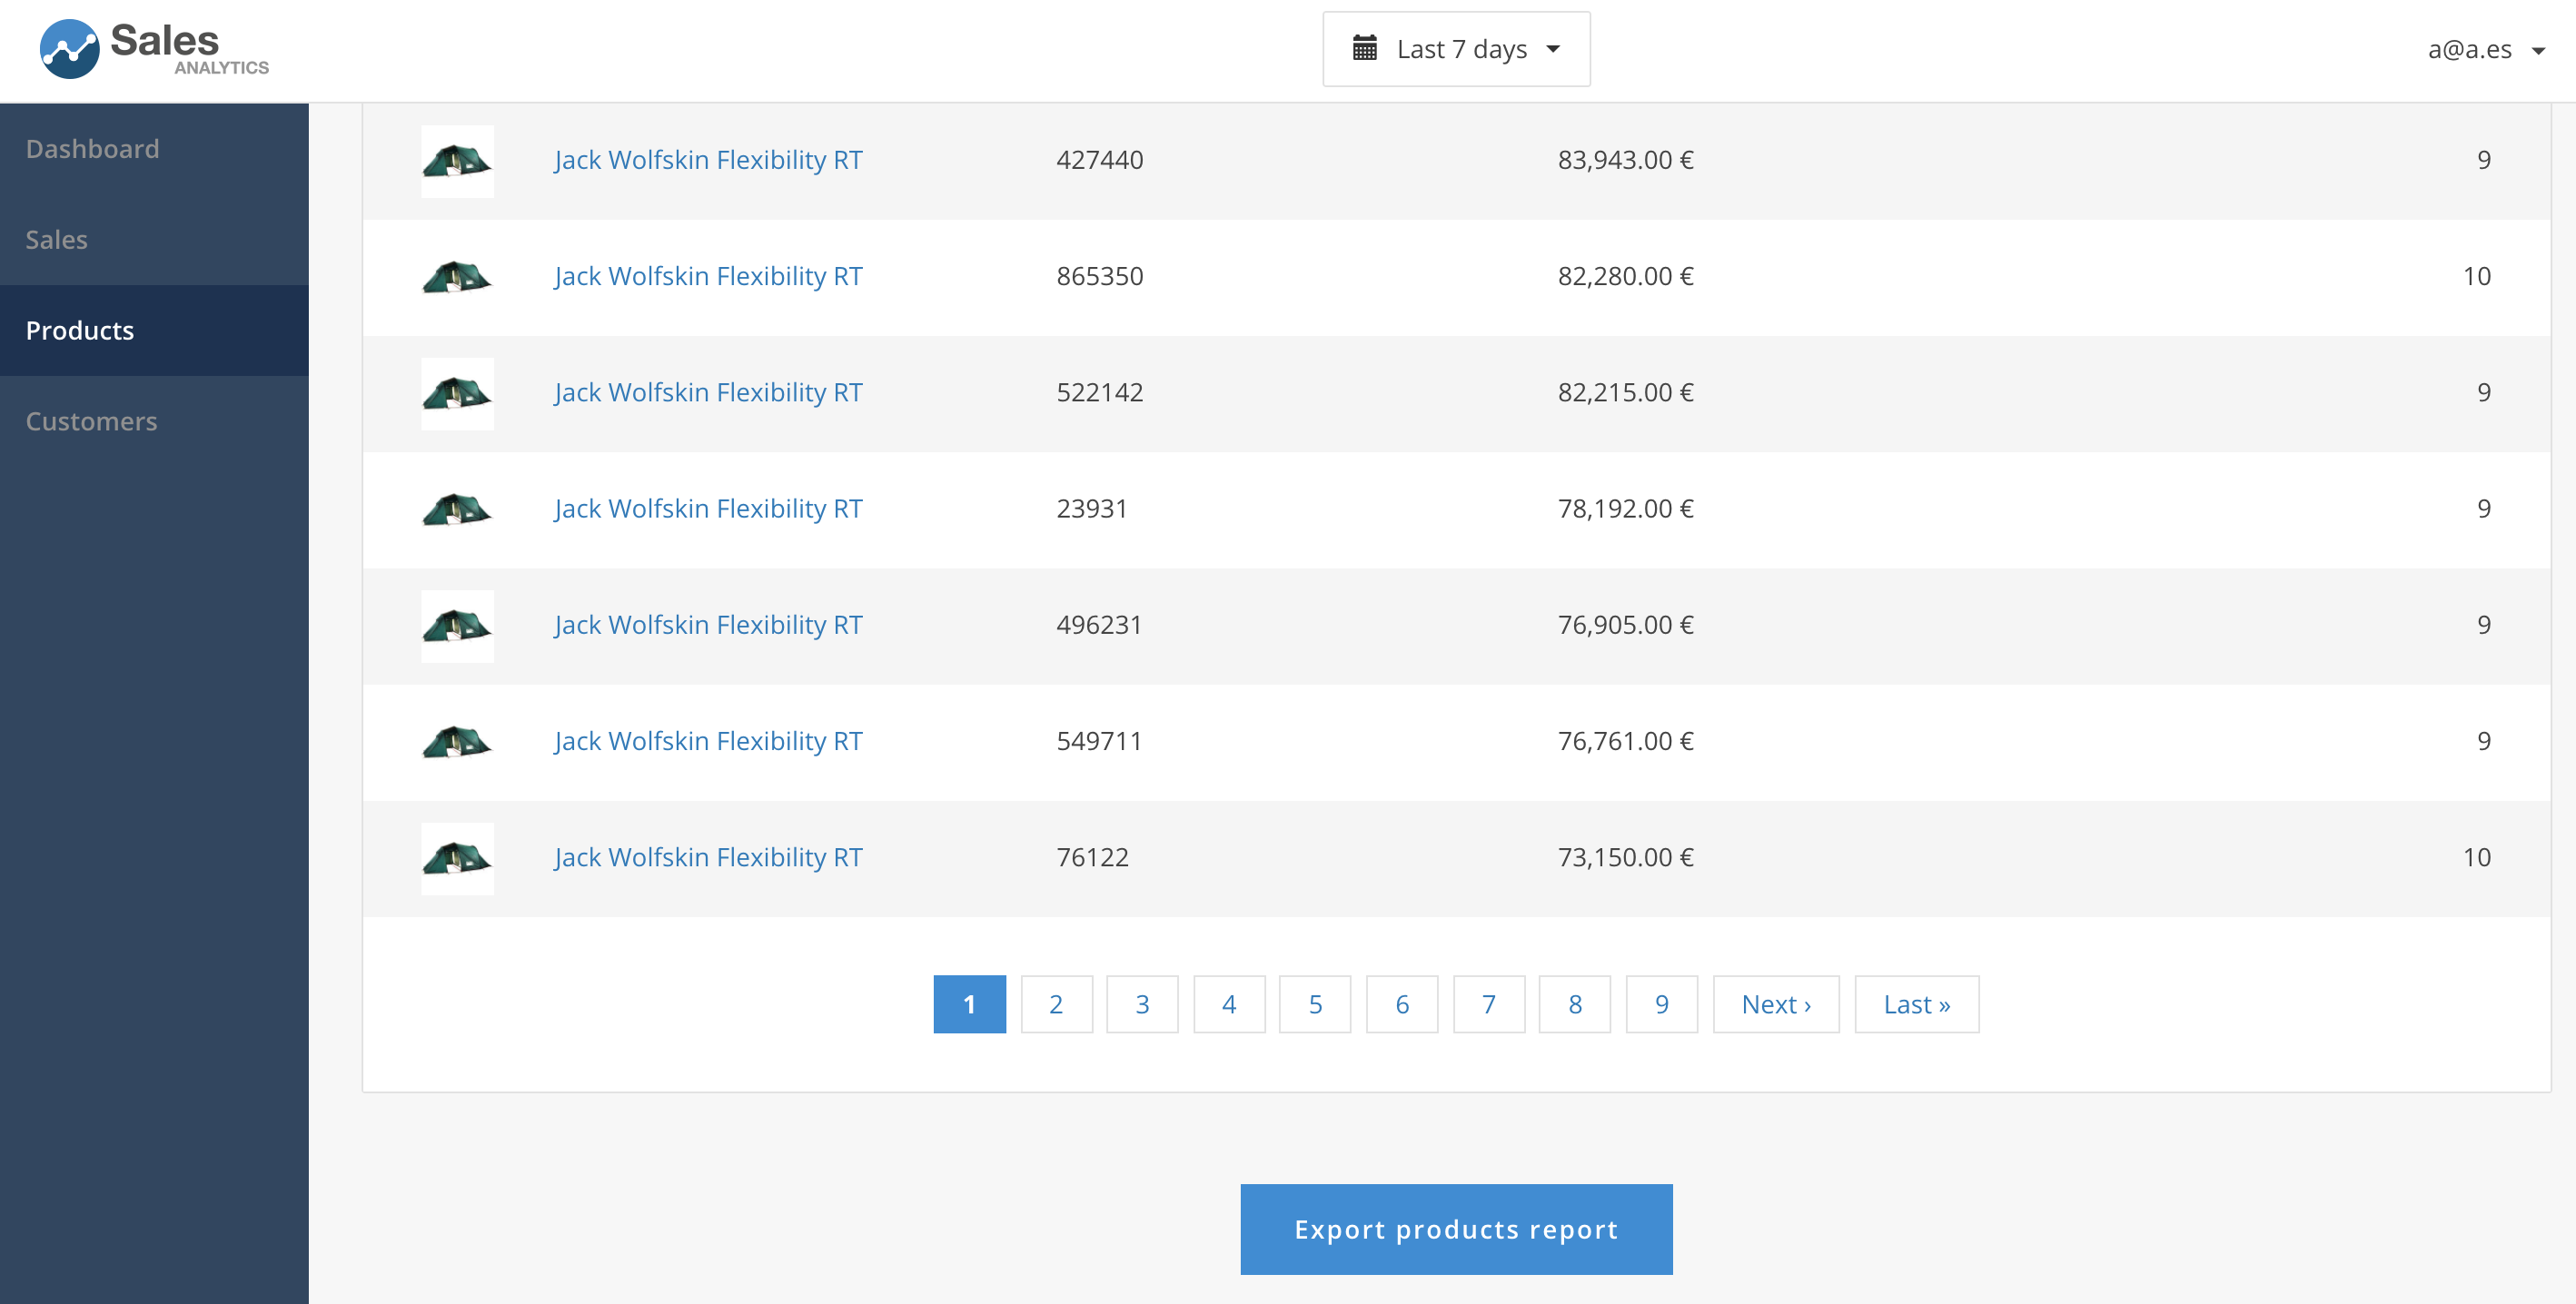
The last part are the Products. In this view, we have the products ordered by revenue or amount of units sold. Here we implemented the functionality of having more insights on the product. By clicking on a product, the product details appear with additional information such as cross-selling products, i.e. what other items have shared orders with. This allows the merchant to maybe realize on connections (or disconnections) between products in a quick and easy way.
Both, the Customers and Products section, have the option to download the data on a csv file.
Other basic functionalities like changing the email address or password as well as a ‘Forgot my password’ option are also included in the app.
Some decisions on technologies
In every project you have to make some decisions on what tech you use. We decided to use Rails - in part because we love it, but also to use our own developed library. On the charts side there are lots of options to choose, but we went with D3, an open source, very powerful and very customizable option. The main reason of picking this was purely educational. I love learning new stuff, libraries, languages, paradigms, you name it; and I already used Highcharts, Google charts and Chart.js, plus I was really curious about it and my team let me decide 😊.
Devise was our option for user management. This gem is easy and simple, so it was perfect to deliver fast (even though in the end everything became more complicated). For this simplicity reason we chose Slim, Sass and CoffeeScript.
Join us on our next blog post, where we will talk about the issues we encountered during the development and how everything was about get more complex than we expected.
Thanks for reading and keep coding!