We implemented a Selenium test report database with Elasticsearch, Logstash, Docker, CircleCI and Jenkins to ease the test evaluation process in our Continuous Delivery Pipeline. Last week we already introduced you to the background of the project and today we want to get your hands on the actual development steps. Hence, this post showcases the various parts of the implemented solution and discusses the pragmatic benefits for our pipeline and our speed-up for massive regression test evaluation.
Furthermore, this article should serve as an outline of the consolidated technical expertise gained throughout the engineering process of this project.
Implemented solution
To get the big picture for splitting the Scrum epic into several stories with tasks and acceptance criteria we created a visualisation, which could distinctly highlight the various parts that needed to be implemented. The first draft of the blueprint was sketched by hand and looked similar to this:
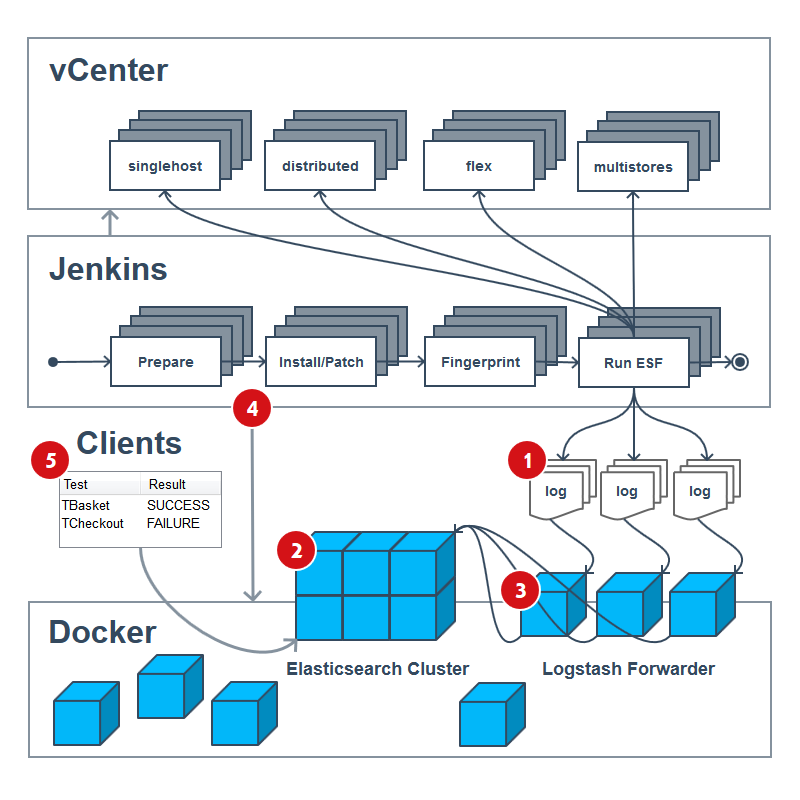
As you can see above, several components of our infrastructure will be affected and also involved throughout the development of this project. The middle tier shows the essential interdigitation of the underlying job chain in our pipeline. Usually, a CDP run involves several prepare jobs; then a huge amount of install and patch jobs are run in parallel on the various VMs of the vCenter (top tier). Afterwards a fingerprint of all machines is created and finally the ESF testsuite (and others) are run onto all vCenter VMs. Sometimes the testsuite is even running against an ePages VM before, during and after patching has started (zero-down-time tests), so don’t take the blueprint to literally.
After the tests have been run, the JSON logs should have been created inside every single Jenkins job. As of now the tricky implementation of this project starts. We have decided to split the implementation in 5 parts and the next sections will explain each one step-by-step.
Part 1 - Define the test object and extend the test suite reporter
Our initial task consisted of the definition of the desired target format for the individual test objects, which would later be stored in Elasticsearch as JSON documents. We determined to create a single object for each test case and represent it as a simple JSON object (without nested fields, like arrays) as this could be easier displayed by several client interfaces of Elasticsearch later on.
{
    "epages_version": "6.17.39.1",
    "epages_repo_id": "6.17.39.1/2016.01.25-19.28.12",
    "env_os": "centos",
    "env_identifier": "distributed_three_hosts",
    "env_type": "install",
    "browser": "firefox",
    "timestamp": "2016-01-26T001726091Z",
    "pos": "3",
    "result": "FAILURE",
    "test": "DigitalTaxmatrixBasketTest.testDigitalTaxmatrixBasket",
    "class": "com.epages.cartridges.de_epages.tax.tests.DigitalTaxmatrixBasketTest",
    "method": "testDigitalTaxmatrixBasket",
    "runtime": "275",
    "report_url": "http://jenkins.intern.epages.de:8080/job/Run_ESF_tests/3778/artifact/esf/esf-epages6-1.15.0-SNAPSHOT/log/20160125T202150651Z/esf-test-reports/com/epages/cartridges/de_epages/tax/tests/DigitalTaxmatrixBasketTest/testDigitalTaxmatrixBasket/test-report.html",
    "stacktrace": "org.openqa.selenium.TimeoutException: Timed out after 30 seconds waiting for presence of element located by: By.className: Saved Build info: version: '2.47.1', System info: host: 'ci-vm-ui-test-004', ip: '127.0.1.1', os.name: 'Linux', os.arch: 'amd64', os.version: '3.13.0-43-generic', java.version: '1.8.0_45-internal' Driver info: org.openqa.selenium.support.events.EventFiringWebDriver at org.openqa.selenium.support.ui.WebDriverWait.timeoutException(WebDriverWait.java:80) at org.openqa.selenium.support.ui.FluentWait.until(FluentWait.java:229) at com.epages.esf.controller.ActionBot.waitFor(ActionBot.java:491) at com.epages.esf.controller.ActionBot.waitFor(ActionBot.java:468) at com.epages.esf.controller.ActionBot.waitFor(ActionBot.java:451) at com.epages.cartridges.de_epages.coupon.pageobjects.mbo.ViewCouponCodes.createmanualCouponCode(ViewCouponCodes.java:159) at com.epages.cartridges.de_epages.tax.tests.DigitalTaxmatrixBasketTest.setupCoupon(DigitalTaxmatrixBasketTest.java:882) at com.epages.cartridges.de_epages.tax.tests.DigitalTaxmatrixBasketTest.testDigitalTaxmatrixBasket(DigitalTaxmatrixBasketTest.java:172)"
}
Some information could be easily gathered by extending our TestReporter located in the core of our ePages Selenium Framework. Thus, we created a writer that could output log files containing single-line JSON test objects with the following fields: browser, pos, result, timestamp, test, class, method, runtime and the stacktrace.
All other fields cannot be derived from our test suite itself and therefore need to be enriched at the processing step in the pipeline. We will discuss these ingredients of the test object in the chapter about Logstash.
Part 2 - Set up Elasticsearch with Docker and CircleCI
Dockerfile
We decided to run the nodes of the Elasticsearch cluster within effortlessly deployable Docker containers. To keep the entire setup at a reasonable level the reuse of the official base image was very helpful. In the Dockerfile we synced our timezone, prepared templating with Jinja2 and installed two plugins for HTTP authorisation and administration via a web frontend that included a tabular document view and an extensive REST-console. We needed to create and use our own docker-entrypoint script as we wanted to map a few more Docker host directories than suggested by the official base image.
Configuration
Besides using variables in the configuration files of Elasticsearch the setup process was quite straightforward. We reduced complexity via a Bash script allowing to build the Docker image and start the container. The start script supports the setting of the needed environment variables for the configuration files and hands them over into the Docker container at runtime.
For the daily operation of the Elasticsearch cluster we implemented a verbose mode in the start script as well as in the docker-entrypoint script so that we could monitor each step in the console output.
Testing
We versioned the entire source code on GitHub. The first file we added was the configuration file for the CircleCI job. The job basically clones the repository and tries to build and run the Docker container. After these described preparation steps several tests check if the Elasticsearch service is reachable from outside of the container and is working as expected. With this setup we could securely develop the Dockerfile and the Elasticsearch configuration files against the previously created tests.
If a pull request was reviewed and merged into the dev branch it will be tested again. If this test run is successful the Docker image will be pushed into our Docker registry and a script merges and pushes the dev code into the master branch.
Deployment
Changes in the master branch trigger a Jenkins Job to run, which pulls the latest Docker image from the registry and restarts the container.
Part 3 - Set up Logstash with Docker and CircleCI
Basics
Within our architecture the Logstash container runs as a comprehensive log forwarder, which means it acts as processor, shipper and indexer of the test results. Hence, it’s main purpose is to read, transform and feed the test objects as documents into our Elasticsearch cluster. For this purpose, the configuration file defines the input and the output of Logstash as well as how the data has to be filtered before dispatching the events to Elasticsearch. The input is given by a file path, which can also contain a regular expression. As described above, we use a JSON log file that is parsed by Logstash. The filter is able to add and remove fields from the JSON object. The output declares where the formatted message should be sent to. In our case this is configurable by environment variables, which will be explained in the following paragraphs.
Configuration
In the Logstash configuration it is possible to use if-statements and environment variables. In addition to this, we decided to write our own templating engine based on the Jinja2 framework to achieve high flexibility in which variables can be fed into the rendering process. This allows us to have an environment-specific configuration for each VM the Docker container is running on. To use this feature, we forward some variables into our container. Our docker-entrypoint script renders the configuration templates and starts the Logstash agent.
######################################
# Add source fields in desired order #
######################################

# only if no error tags were created
if (![tags]) {

    # add needed env variables to event
    mutate {
        add_field => {
            "note" => ""
            "epages_version" => "{{ EPAGES_VERSION }}"
            "epages_repo_id" => "{{ EPAGES_REPO_ID }}"
            "env_os" => "{{ ENV_OS }}"
            "env_identifier" => "{{ ENV_IDENTIFIER }}"
            "env_type" => "{{ ENV_TYPE }}"
        }
    }
}

# extract esf fields from message; the content wrapper
json { source => "message" }

# only if no error tags were created
if (![tags]) {

    # add needed env variables to event
    mutate {
        add_field => {
            "report_url" => "{{ ENV_URL }}%{test_url}"
        }
    }
}

###################################
# Remove not needed source fields #
###################################

# only if no error tags were created
if (![tags]) {

    # remove not needed fields from extraction of message
    mutate { remove_field => [ "host", "message", "path", "test_url", "@timestamp", "@version" ] }
}

######################
# Create document id #
######################

# only if no error tags were created
if (![tags]) {

    if [env_identifier] != "zdt" {

        # generate elasticsearch document id from several esf fields
        fingerprint {
            target => "[@metadata][ES_DOCUMENT_ID]"
            source => ["epages_repo_id", "env_os", "env_type", "env_identifier", "browser", "class", "method"]
            concatenate_sources => true
            key => "any-long-encryption-key"
            method => "SHA1"    # return the same hash if all values of source fields are equal
        }

    } else {

        # do not overwrite results for zdt environment identifier
        fingerprint {
            target => "[@metadata][ES_DOCUMENT_ID]"
            source => ["epages_repo_id", "env_os", "env_type", "env_identifier", "browser", "class", "method", "report_url"]
            concatenate_sources => true
            key => "any-long-encryption-key"
            method => "SHA1"    # return the same hash if all values of source fields are equal
        }

    }
}
In the listing above you can see an excerpt of the filter part of the configuration file. The first statement adds a new field report_url to the JSON object. Therefore, we concatenate an environment variable with a field that was defined in the original JSON object to obtain a complete URL. The second statement creates a fingerprint needed for the Elasticsearch document ID that will be added to a metadata field. The fingerprint will be created from the fields specified by the key source.
{%- if "elasticsearch" in LS_OUTPUT or "document" in LS_OUTPUT or "template" in LS_OUTPUT %}

############################
# Output for elasticsearch #
############################

# only if no error tags were created
if (![tags]) {

    # push esf events to elasticsearch
    elasticsearch {

       # set connection
       hosts => {{ ES_HOSTS }}

       {%- if ES_USER and ES_PASSWORD %}

       # set credentials
       user => "{{ ES_USER }}"
       password => "{{ ES_PASSWORD }}"
       {%- endif %}

       {%- if "elasticsearch" in LS_OUTPUT or "document" in LS_OUTPUT %}

       # set document path
       index => "{{ ES_INDEX }}"
       document_type => "{{ ES_DOCUMENT_TYPE }}"
       document_id => "%{[@metadata][ES_DOCUMENT_ID]}"
       {%- endif %}

       {%- if "elasticsearch" in LS_OUTPUT or "template" in LS_OUTPUT %}

       # use template for settings and mappings
       manage_template => true
       template => "{{ LS_CONFIG_VOL }}/template-esf.json"
       template_name => "{{ ES_INDEX }}"
       template_overwrite => true
       {%- endif %}
    }
}
{%- endif %}
The above code snippet shows how we push the output to our Elasticsearch cluster. The first line represents how we use our own templating engine. If the if-statement is false, the part configuring the output to Elasticsearch will be omitted. If it equals true, we use environment variables as well as information from our metadata for connection, document path and Elasticsearch index template, which contains index settings and the mappings of document fields to the desired data types. We also have written a similar construct to generate the output to stdout, an error log file and an info log file, which later contains successfully pushed data for monitoring reasons.
Testing
The CI part for our Logstash container is very similiar to that of the Elasticsearch container. The tests we run are different of course, but the process is the same.
Part 4 - Integrate Docker containers in pipeline with Jenkins
Logstash
We have several pipeline jobs that run the test suite of the ePages Selenium Framework against all kinds of ePages setups. As a result they produce, amongst a bunch of other files, a log file with the JSON test objects as described in part 1.
In such Jenkins jobs we added a separate build step where we first check that all required environment variables are set. Then we pull the Logstash container from the registry and use the start script to run the container accordingly. Below you can see an extract of the console output in verbose mode.
=== Start docker container [to-logstash-run-esf-tests-3829] from image [epages/to-logstash:latest] ===

Process logs with pattern:          *esf*.json
Mount log directory:                /home/jenkins/workspace/Run_ESF_tests/esf/esf-epages6-1.15.0-SNAPSHOT/log
Mount config directory:             /home/jenkins/workspace/Run_ESF_tests/to-logstash/config
Set logstash input types:           log,esf
Set logstash output types:          log,elasticsearch,verbose
Use logstash env file:              env-esf.list
Use logstash conf file:             logstash-esf.conf
Use info log file:                  logstash-info.json
Use error log file:                 logstash-error.json
Use elasticsearch template file:    template-esf.json
Set elasticsearch hosts:            [ 'cd-vm-docker-host-001.intern.epages.de:9200' ]
Set elasticsearch index:            esf-cdp-ui-tests
Set elasticsearch document type:    6.17.40

--- Start configuration is applied.

a8fa29d74ef97832fcfbc3a0722b728a465244263c9d482b6eec6357d184555b

--- Logstash finished processing and container is terminated.

=== No need to stop not running docker container [to-logstash-run-esf-tests-3829] ===

=== Remove existing docker container [to-logstash-run-esf-tests-3829] ===

to-logstash-run-esf-tests-3829
All shipped test objects are saved to a Logstash info log, which is archived as a build artifact in the post-build section of Jenkins.
Elasticsearch
For our Elasticsearch Docker cluster we configured a new Jenkins job, which ensured that always the latest stable version of our image is used. We made sure to mount several host directories so that the Elasticsearch data, config and logs are stored on the VM. By firing up multiple Elasticsearch node containers joining the same cluster we achieved load-balance and shard redundancy.
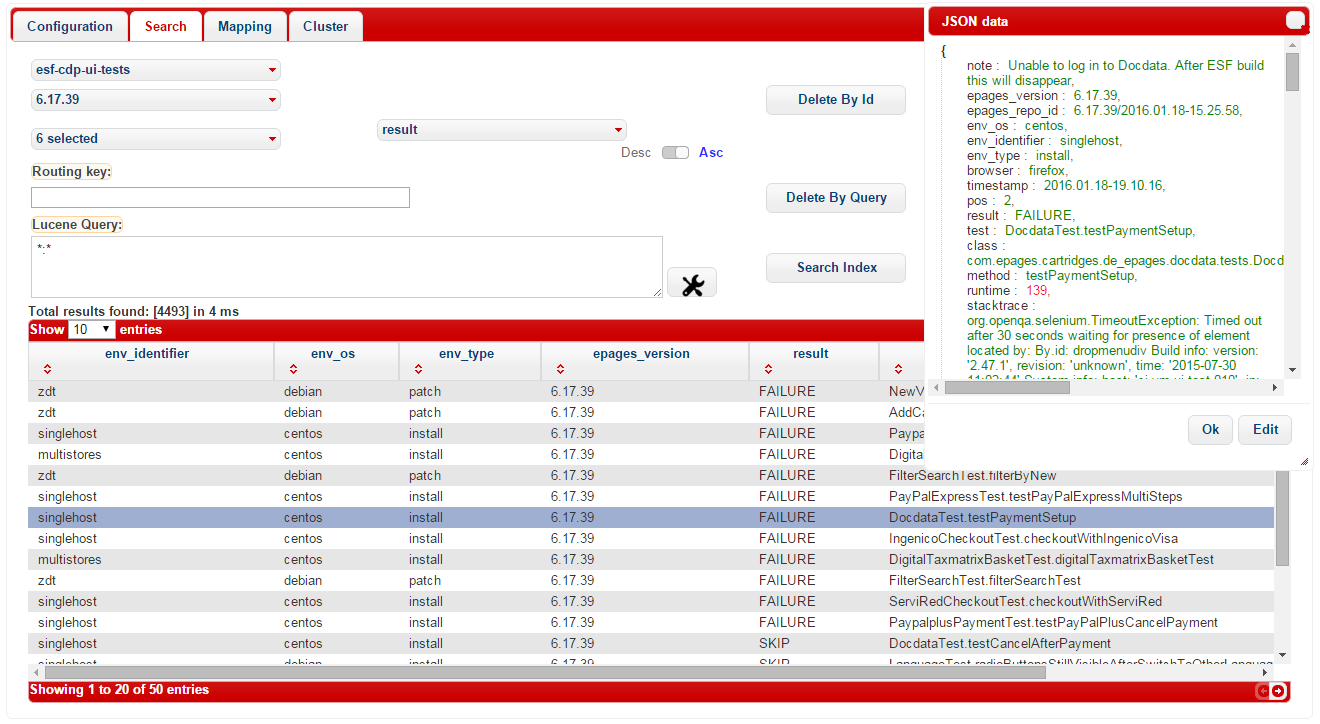
Part 5 - Use the Elasticsearch Client to evaluate the test results
In the current state we use the Elasticsearch Client to monitor and analyse the test results. Here you can browse and filter the documents via dropdown menus for the index, which is our test object type (e.g. cdp-ui-tests) and the document type, which is the ePages repo id (e.g. 6.17.39). You can then narrow down the search with simple matches in the search field (e.g. only show tests with result FAILURE) or use the official Lucence Query, which supports boolean operators, range matchers and more advanced features similar to a regex. It is possible to edit every single test object within the client by double-clicking a tabular row. Therefore, the note field can be used to add information about the error, like the cause of the error and the corresponding JIRA issue id.
Additionally, we also take advantage of three other ways to access our Elasticsearch cluster:
- via the Elasticsearch Head plugin
- via curl and the Elasticsearch DSL simple query string
- via URI requests in the location bar of the browser, e.g.:
# URI Schema
<protocol>://<domain>:<port>/<index>/<document_type>/_count?=<query_string>
<protocol>://<domain>:<port>/<index>/<document_type>/_search?=<query_string>

# Query String Example
?pretty&size=1000&q=result:failure,skip AND epages_repo_id:*17.06.15
Benefits and conclusion
Today the evaluation process is much faster: usually less than 5 minutes a day. The tremendous amount of saved time helps a lot in working on other stories.
Besides the in-depth exploration of the ELK ecosystem, which goes way beyond this short article, we also learned a lot of useful craftsmanship skills:
- How to apply TDD to Docker containers with encapsulated services.
- How to write even more infrastructure as code in the case of CI jobs.
- How to run a CircleCI job efficiently on parallel nodes if multiple ones are available.
- How to not only enjoy the productivity of intense pair programming sessions but also when to quickly switch back to code along separately.
Overall we are very happy with the outcome of this project and hope we can spend all the freed up time on other awesome projects about which we can write more blog posts.
Related post
Optimised monitoring and evaluation of Selenium test results