Structured log events and distributed tracing were covered in the first two posts of our series about debugging microservices. In this post we will even further enhance our request tracing, and finally be able to peek into a running microservice from our IDE.
Color me interested
With the help of Sleuth and Zipkin we are able to search for and correlate log events belonging to a particular trace. For that we need to know its unique trace id, that could be part of a REST API response header and noted down for later log analysis in case of an error. Another approach is to first come up with a trace id and already provide it along with the initial REST API request to be carried throughout the whole request processing. You can think of it as painting your request with a signal color, that is easy to spot between all the other dull requests.
Howling at the moon
With the help of the scripting language Lua (Portuguese for “moon”) we can enhance our nginx that acts as a central API gateway.
We use OpenResty as an alternative to vanilla nginx, as it comes along with a preconfigured Lua environment with many useful libraries.
Put the following snippet somewhere inside a server {} block of your nginx configuration:
# initialize variables
set $trace_id '';
set $span_id '';

set_by_lua_block $trace_id {
  local function hex32()
    local pattern  = ""
    for i = 1, 32, 1 do
      pattern = pattern .. "[0-9a-f]"
    end
    return "^" .. pattern .. "$"
  end

  local trace_id = ngx.var.http_x_b3_traceid or ngx.var.request_id
  if not trace_id:match(hex32()) then
    trace_id = ngx.var.request_id
  end
  ngx.var.span_id = trace_id:sub(1, 16)
  return trace_id
}

location / {
  # point to your upstream server
  proxy_pass http://10.0.0.1:8080;

  # set upstream headers
  proxy_set_header X-B3-TraceId      $trace_id;
  proxy_set_header X-B3-SpanId       $span_id;
  proxy_set_header X-Forwarded-Host  $host;
  proxy_set_header X-Forwarded-For   $proxy_add_x_forwarded_for;
  proxy_set_header X-Forwarded-Proto $scheme;

  # add response header
  add_header X-B3-TraceId $trace_id always;
}
The set_by_lua_block {} directive allows us to directly inline Lua scripting code.
Due to Lua’s limited pattern matching support, we can’t use curly braces as repetition quantifiers known from PCRE.
Instead, the local function hex32() serves as a workaround to create a pattern to exactly match 32 hexadecimal characters like ^[0-9a-f]{32}$ - that is the 128-bit format our trace ids must follow.
This solution checks if a request header named X-B3-TraceId exists by evaluating the ngx.var.http_x_b3_traceid nginx variable (note: HTTP headers are case-insensitive).
If such a header is found and it matches our desired trace id format, we will use it for all proxied upstream requests.
Otherwise we let nginx create a fresh trace id randomly via its ngx.var.request_id nginx variable.
We also derive a 64-bit span id from the first 16 characters of the trace id, as required by the B3 specification.
X-B3-SpanId as well as a number of typical X-Forwarded-* headers are also sent to our upstream microservices, while we send back the X-B3-TraceId as response header.
Now we can mark our HTTP request with a custom trace id, and it will be propagated upstream into our system of distributed microservices before being echoed back to us as an HTTP response header:
$ curl --include --header 'X-B3-TraceId: dead0000beef0000cafe0000babe0000' https://api-gateway/
HTTP/1.1 200 OK
Date: Wed, 29 Nov 2017 16:12:59 GMT
Content-Type: application/json
Content-Length: 123
Connection: keep-alive
Server: openresty
X-B3-TraceId: dead0000beef0000cafe0000babe0000

{
   ...
}
Searching for dead0000beef0000cafe0000babe0000 in our log analysis systems will yield only those log events, that have been generated while processing our marked request.
Logging is just a poor man’s debugging
To quote Twitter, since Twitter is never wrong:
There was a 'Moved Permanently' error fetching URL: 'https://twitter.com/_shuLhan/status/932521300693696512'
But it still happens that you did not foresee to include a proper log statement in your application code. Then one final option is to start a real debugger (as provided by your favourite IDE) and attach it to a running process to have better insights of what is actually going on in your code.
At ePages we are running compiled Java code inside Docker containers in the cloud.
The Java Platform Debugger Architecture (JPDA) specifies a Java Debug Wire Protocol (JDWP) for allowing debuggers to connect to a remotely running Java virtual machine via TCP/IP.
We secured network access to our Docker containers’ debug port, so that only authorised clients can use this.
That enables us to use JDWP by providing a debug port to our Java processes using the JAVA_TOOL_OPTIONS environment variable with a value of -agentlib:jdwp=transport=dt_socket,server=y,suspend=n,address=8000.
In a local Docker environment, you can use this command:
$ docker run --interactive --tty --rm \
  --publish 8080:8080 --publish 8000:8000 \
  --env JAVA_TOOL_OPTIONS="-agentlib:jdwp=transport=dt_socket,server=y,suspend=n,address=8000" \
  epages/ng-tax:latest \
  --spring.profiles.active=docker \
  --spring.cloud.config.enabled=false

Picked up JAVA_TOOL_OPTIONS: -agentlib:jdwp=transport=dt_socket,server=y,suspend=n,address=8000
Listening for transport dt_socket at address: 8000
2017-11-30 13:50:11.055  INFO 1 --- [           main] com.epages.tax.TaxApplication            : The following profiles are active: docker
2017-11-30 13:50:22.020  INFO 1 --- [           main] com.epages.tax.TaxApplication            : Started TaxApplication in 13.083 seconds (JVM running for 14.0)
In our example we started a microservice responsible for determining the tax rates for transactions between two countries. We can send a sample REST request to its local Docker IP and port:
$ curl http://192.168.99.100:8080/tax-configurations/DE/destinations/FR/tax-rates

{
  "_embedded" : {
    "taxRates" : [ {
      "taxClass" : "REGULAR",
      "value" : 0.19
    }, {
      "taxClass" : "REDUCED",
      "value" : 0.07
    }, {
      "taxClass" : "EXEMPT",
      "value" : 0.0
    } ]
  }
}

2017-11-30 14:34:37.920 DEBUG 1 --- [        http-25] c.e.t.c.TaxConfigurationController       : fetching tax rates
The emitted log message fetching tax rates does not give us enough details about how these tax rates have been determined, so we want to start a deeper crime scene investigation by stepping through the request processing with a debugger.
CSI: Microservices
In order to attach a debugger to a running microservice, we need to setup our favorite IDE by providing the correct JDWP settings:
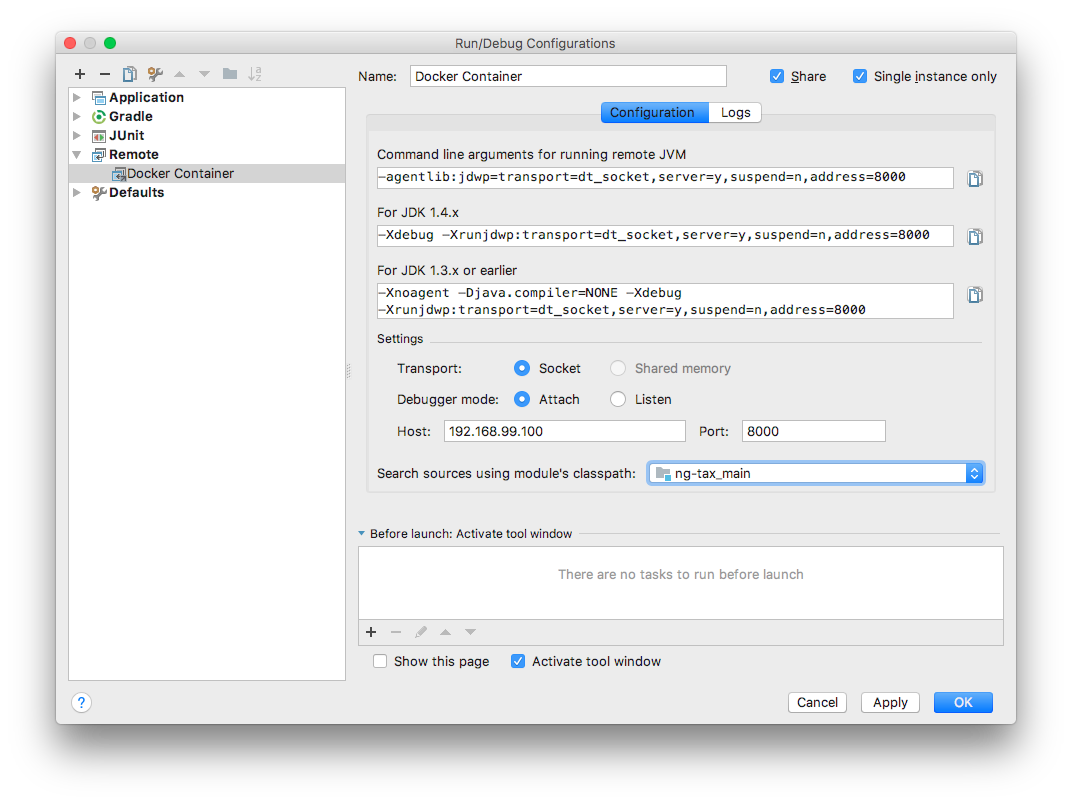
When the next request is being served by our microservice, our IDE will automatically interrupt the execution at a breakpoint that we have explicitly provided. Now we can step through single lines of code execution in order to inspect runtime variables and find out if our code is already prepared for an upcoming Brexit tax rate change 😉
The loot of our heist: pearls of wisdom
Now that we have all the tools and processes at hand to properly hunt for bugs in our system, let us come to realise this final conclusion:
There was a 'Moved Permanently' error fetching URL: 'https://twitter.com/CodeWisdom/status/897911593878511617'
Related posts
About the author
