The first post in this series of blog posts about debugging microservices covered how we can produce structured log events to ease log aggregation.
We also introduced the concept of log correlation using a correlation-id, that spans multiple microservices to connect related log events.
In this second post we will enhance the JSON log structure, and dive deeper into the topic of distributed tracing.
Custom JSON structure
At ePages we use Google’s Stackdriver Logging infrastructure to aggregate all our log events, thus we need to adjust our JSON structure to follow their format:
We want to rename the default JSON properties @timestamp and level to time and severity respectively, while completely dropping @version, level_value, and thread_name.
Using Spring Boot’s support for Logback, we control the JSON structure by introducing a custom encoder layout in this logback-spring.xml file:
<?xml version="1.0" encoding="UTF-8"?>
<configuration>
    <include resource="org/springframework/boot/logging/logback/defaults.xml"/>
    <springProperty scope="context" name="app" source="spring.application.name"/>
    <appender name="STDOUT" class="ch.qos.logback.core.ConsoleAppender">
        <encoder class="net.logstash.logback.encoder.LoggingEventCompositeJsonEncoder">
            <providers>
                <timestamp>
                    <fieldName>time</fieldName>
                    <pattern>yyyy-MM-dd'T'HH:mm:ss.SSS'Z'</pattern>
                    <timeZone>UTC</timeZone>
                </timestamp>
                <logLevel>
                    <fieldName>severity</fieldName>
                </logLevel>
                <context/>
                <pattern>
                    <pattern>{ "correlation-id": "%mdc{correlation-id:-}" }</pattern>
                </pattern>
                <loggerName>
                    <fieldName>logger</fieldName>
                </loggerName>
                <message/>
            </providers>
        </encoder>
    </appender>
    <root level="INFO">
        <appender-ref ref="STDOUT"/>
    </root>
</configuration>
The JSON property app is rendered by the <context/> JSON provider, which gets its value from the <springProperty/> element used to access the spring.application.name configuration value that is available for every Spring Boot app.
The correlation-id is fetched from the Mapped Diagnostic Context (as introduced in the previous blog post) using the special conversion word %mdc{}.
A typical stream of log events produced by processing a single request spanning the microservices named ping, pong, and ack behind our api-gateway in our (artificial) system looks like this:
{
  "time": "2017-08-09T16:20:11.242Z",
  "severity": "INFO",
  "app": "ping",
  "correlation-id": "889ef8b52abdaf7559850bef6c86e157",
  "logger": "com.epages.pingpong.PingPongController",
  "message": "PING working hard for 1s"
} {
  "time": "2017-08-09T16:20:12.248Z",
  "severity": "INFO",
  "app": "pong",
  "correlation-id": "889ef8b52abdaf7559850bef6c86e157",
  "logger": "com.epages.pingpong.PingPongController",
  "message": "PONG working hard for 1s"
} {
  "time": "2017-08-09T16:20:13.254Z",
  "severity": "INFO",
  "app": "ack",
  "correlation-id": "889ef8b52abdaf7559850bef6c86e157",
  "logger": "com.epages.pingpong.PingPongController",
  "message": "ACK working hard for 0s"
} {
  "time": "2017-08-09T16:20:13+00:00",
  "severity": "INFO",
  "app": "api-gateway",
  "correlation-id": "889ef8b52abdaf7559850bef6c86e157",
  "logger": "access_log",
  "message": "GET /ping HTTP/1.1"
}
And then it crashed!
In our example it is possible, that one of the participating microservices produces an error, causing the whole request spanning all microservices to fail.
For investigating these kinds of failures it is important to also get access to the stacktrace providing detailed information.
Stacktraces in Java can get pretty unwieldy and long, and they happen to hide the most important information at the very bottom.
We introduce a special <stackTrace/> JSON provider, that can be configured to truncate noisy stacktrace frames (e.g. from invocation via reflection), and moves the root cause to the top. The <stackHash/> JSON provider will create a short and stable signature from an exception, so that we can count distinct types of errors, and detect new ones easily.
<stackHash>
    <fieldName>exception-hash</fieldName>
</stackHash>
<stackTrace>
    <fieldName>exception</fieldName>
    <throwableConverter class="net.logstash.logback.stacktrace.ShortenedThrowableConverter">
        <shortenedClassNameLength>short</shortenedClassNameLength>
        <maxDepthPerThrowable>short</maxDepthPerThrowable>
        <maxLength>short</maxLength>
        <rootCauseFirst>true</rootCauseFirst>
        <exclude>sun\.reflect\..*\.invoke.*</exclude>
    </throwableConverter>
</stackTrace>
A log event emitted in case of an exception looks like this (after applying some additional manual trimming):
{
  "time": "2017-08-09T16:18:52.384Z",
  "severity": "ERROR",
  "app": "ping",
  "correlation-id": "d82f882ec1fb71386f9ece8a9420f0d7",
  "logger": "com.epages.pingpong.PingPongController",
  "message": "Error calling http://service/",
  "exception-hash": "318b233f",
  "exception": "java.net.SocketTimeoutException: Read timed out
    at java.net.SocketInputStream.socketRead0(SocketInputStream.java)
    at java.net.SocketInputStream.socketRead(SocketInputStream.java:116)
    at java.net.SocketInputStream.read(SocketInputStream.java:171)
    at java.net.SocketInputStream.read(SocketInputStream.java:141)
    at java.io.BufferedInputStream.fill(BufferedInputStream.java:246)
    at java.io.BufferedInputStream.read1(BufferedInputStream.java:286)
    at java.io.BufferedInputStream.read(BufferedInputStream.java:345)
    at sun.net.www.http.HttpClient.parseHTTPHeader(HttpClient.java:735)
    at sun.net.www.http.HttpClient.parseHTTP(HttpClient.java:678)
    at sun.net.www.protocol.http.HttpURLConnection.getInputStream0(HttpURLConnection.java:1569)
    at sun.net.www.protocol.http.HttpURLConnection.getInputStream(HttpURLConnection.java:1474)
    at java.net.HttpURLConnection.getResponseCode(HttpURLConnection.java:480)
    at org.springframework.http.client.SimpleBufferingClientHttpRequest.executeInternal(SimpleBufferingClientHttpRequest.java:84)
    at org.springframework.http.client.AbstractBufferingClientHttpRequest.executeInternal(AbstractBufferingClientHttpRequest.java:48)
    at org.springframework.http.client.AbstractClientHttpRequest.execute(AbstractClientHttpRequest.java:53)
    at org.springframework.http.client.InterceptingClientHttpRequest$InterceptingRequestExecution.execute(InterceptingClientHttpRequest.java:99)
    at org.springframework.http.client.InterceptingClientHttpRequest$InterceptingRequestExecution.execute(InterceptingClientHttpRequest.java:86)
    at org.springframework.http.client.InterceptingClientHttpRequest.executeInternal(InterceptingClientHttpRequest.java:70)
    at org.springframework.http.client.AbstractBufferingClientHttpRequest.executeInternal(AbstractBufferingClientHttpRequest.java:48)
    at org.springframework.http.client.AbstractClientHttpRequest.execute(AbstractClientHttpRequest.java:53)
    at org.springframework.web.client.RestTemplate.doExecute(RestTemplate.java:652)
    ... 60 common frames omitted
    Wrapped by: org.springframework.web.client.ResourceAccessException: I/O error on GET request for \"http://service/\": Read timed out; nested exception is java.net.SocketTimeoutException: Read timed out
    at org.springframework.web.client.RestTemplate.doExecute(RestTemplate.java:666)
    at org.springframework.web.client.RestTemplate.execute(RestTemplate.java:613)
    at org.springframework.web.client.RestTemplate.getForObject(RestTemplate.java:287)
    at com.epages.pingpong.PingPongController.process(PingPongController.java:31)
    ... 3 frames excluded"
}
Microservices murder mystery
Finding the cause of an outage is a real challenge for organizations that operate with many services:
We replaced our monolith with micro services so that every outage could be more like a murder mystery.
— Honest Status Page (@honest_update) October 7, 2015
To solve that problem, Google created their own infrastructure for distributed tracing called Dapper, and in 2010 they published a paper describing their solution. Based on that design, a project initially called Big Brother Bird (B3) was created at Twitter, and later open-sourced under the name Zipkin.
Zipkin can be used to gather, store, and visualize timing as well as latency information in a distributed system, and strives for interoperability of different instrumentations provided by various vendors and programming languages. The whole request processed by a distributed system is called a trace, and can be modeled as a tree of multiple spans, forming the basic units of work. The timing information for each span, and for the whole trace are stored along with additional meta information in Zipkin. To get this data into Zipkin we use Spring Cloud Sleuth, which nicely integrates with Spring Boot, and automatically instruments all HTTP requests going from one microservice to another with a number of additional HTTP headers.
Most importantly, Sleuth introduces the HTTP headers X-B3-TraceId, X-B3-SpanId and X-B3-ParentSpanId, all starting with X-B3- (in reference to the original project name) as documented in the B3 specification, plus X-Span-Export to mark a particular span as having been sampled to Zipkin.
The instrumentation also ensures that these values are properly stored in the MDC, allowing easy use in our Logback configuration.
We can modify our logback-spring.xml to use X-B3-TraceId for correlation (and renaming the JSON property correlation-id to trace), while removing the other Sleuth headers from our log event:
<pattern>
    <pattern>{ "trace": "%mdc{X-B3-TraceId:-}" }</pattern>
</pattern>
<mdc>
    <excludeMdcKeyName>X-B3-SpanId</excludeMdcKeyName>
    <excludeMdcKeyName>X-B3-TraceId</excludeMdcKeyName>
    <excludeMdcKeyName>X-B3-ParentSpanId</excludeMdcKeyName>
    <excludeMdcKeyName>X-Span-Export</excludeMdcKeyName>
</mdc>
Sleuth-instrumented requests then produce log events like this:
{
  "time": "2017-08-10T07:51:04.796Z",
  "severity": "INFO",
  "app": "ack",
  "trace": "ab6e804ebf7fd7f042962079b19585b4",
  "logger": "com.epages.pingpong.PingPongController",
  "message": "ACK working hard for 1s"
}
Tracing the suspect
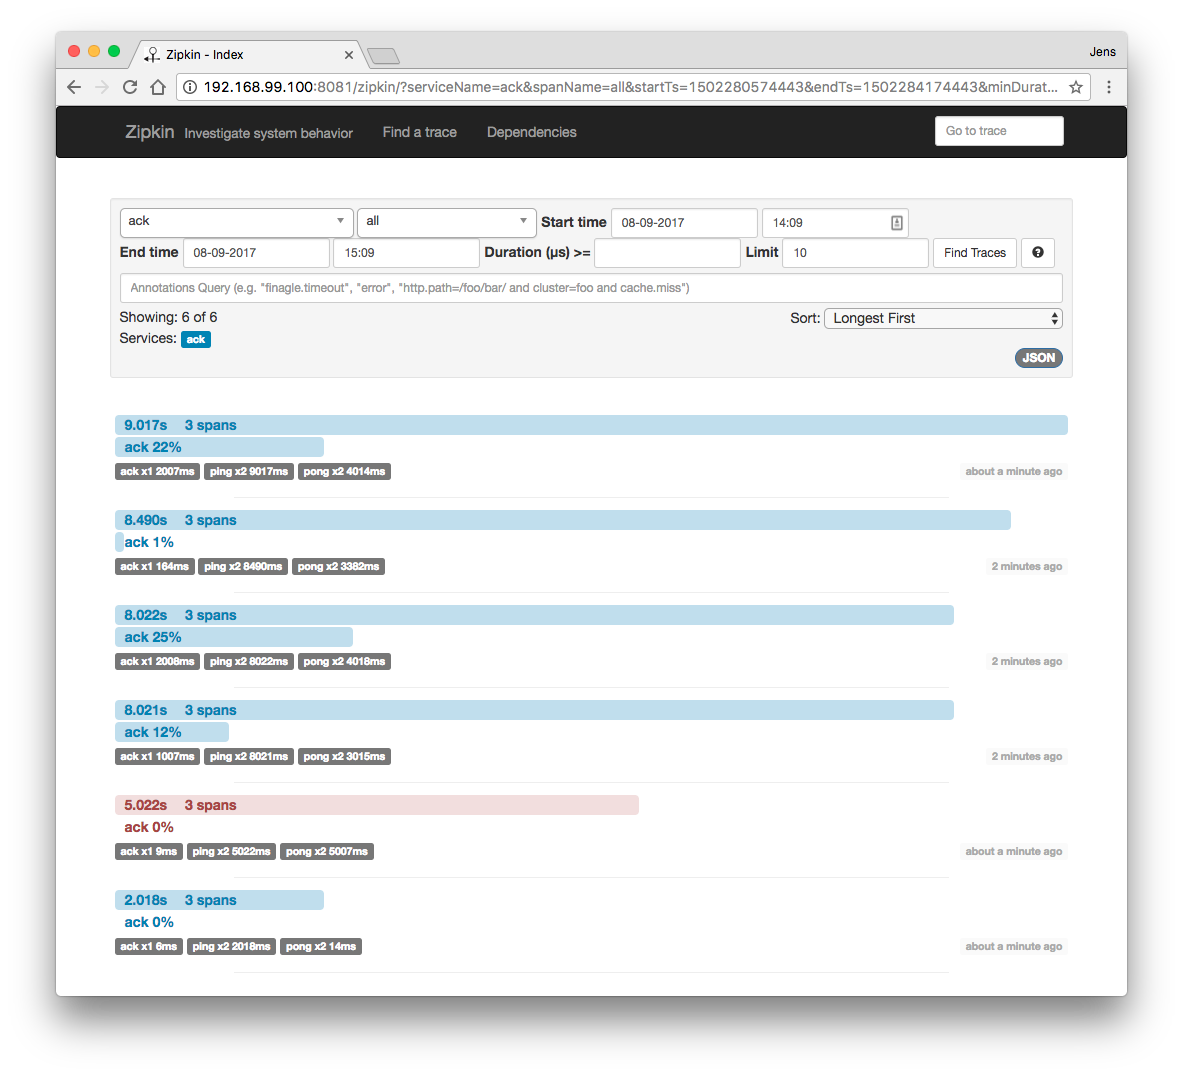
The Zipkin web application offers a nice visualization of all traces that have been sampled:
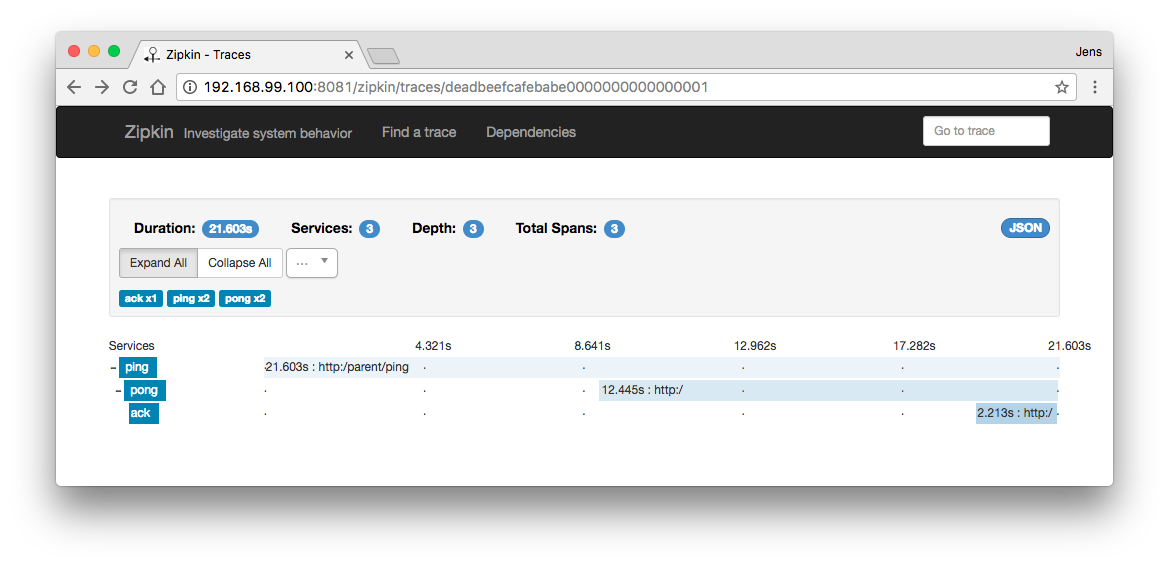
Drilling down into a specific trace offers detailed information about the timings of all affected spans:
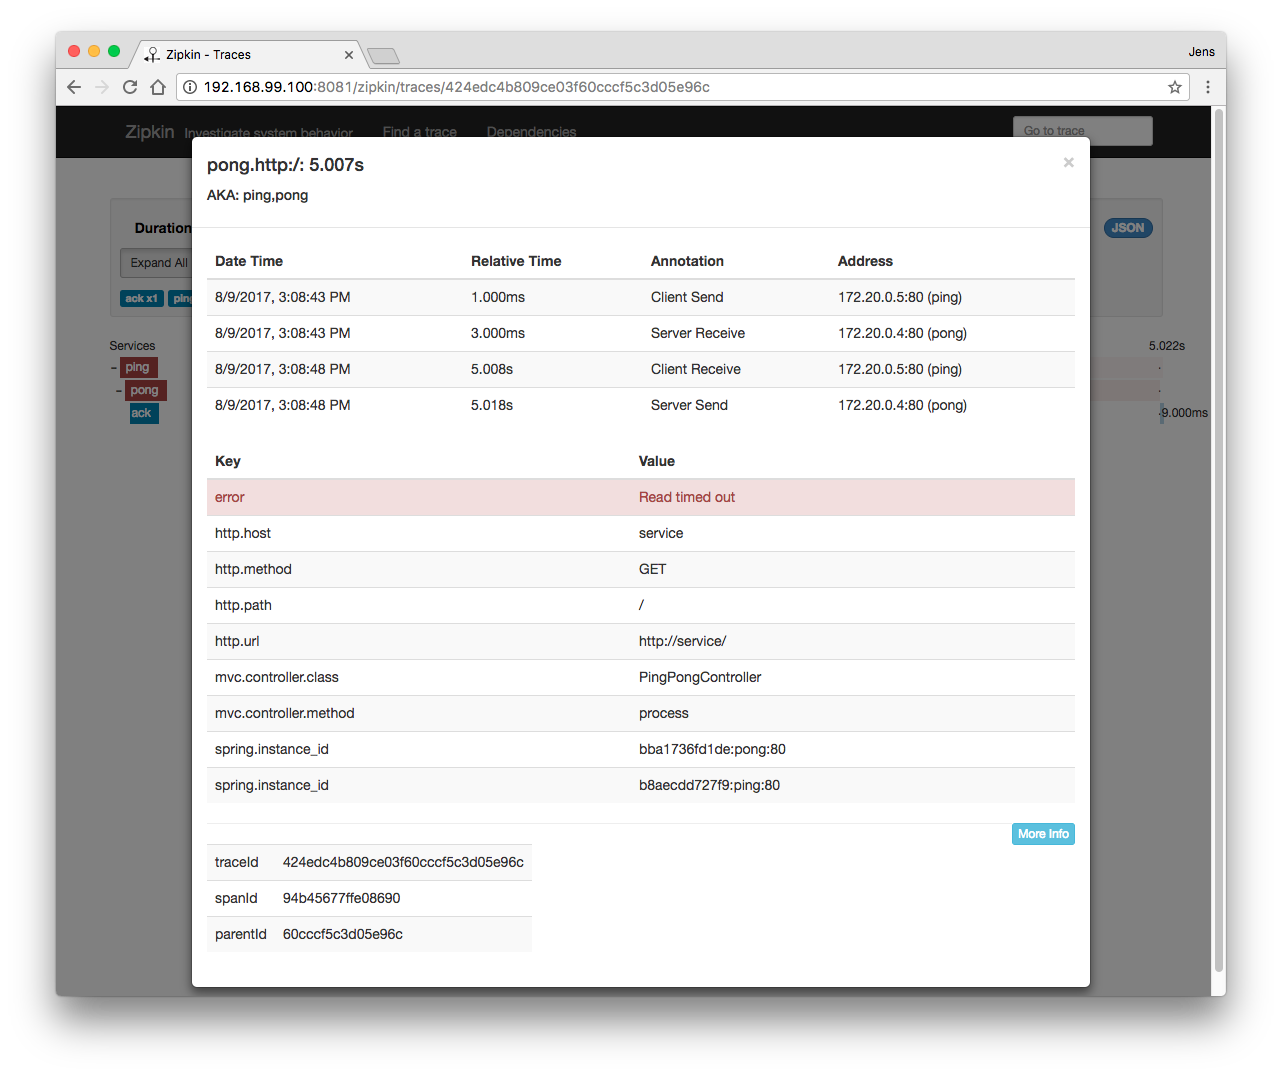
A trace with a failed span is marked red and can be inspected for further details:
Announcing our verdict
With Open Source tools such as Sleuth and Zipkin, we gain better visibility into the runtime behavior of our microservices. They give us an easy way to analyze failures, and spot areas for performance optimization. Besides log aggregation, they form an invaluable addition to our DevOps tool chain.
In an upcoming final post in our blog series about debugging microservices, we will have a look at providing trace ids from the outside by embedding dynamic scripting capabilities into our api-gateway. We will also show how to attach an IDE debugger to a running microservice container to finally access all the internal details to solve even the most intricate bugs.


